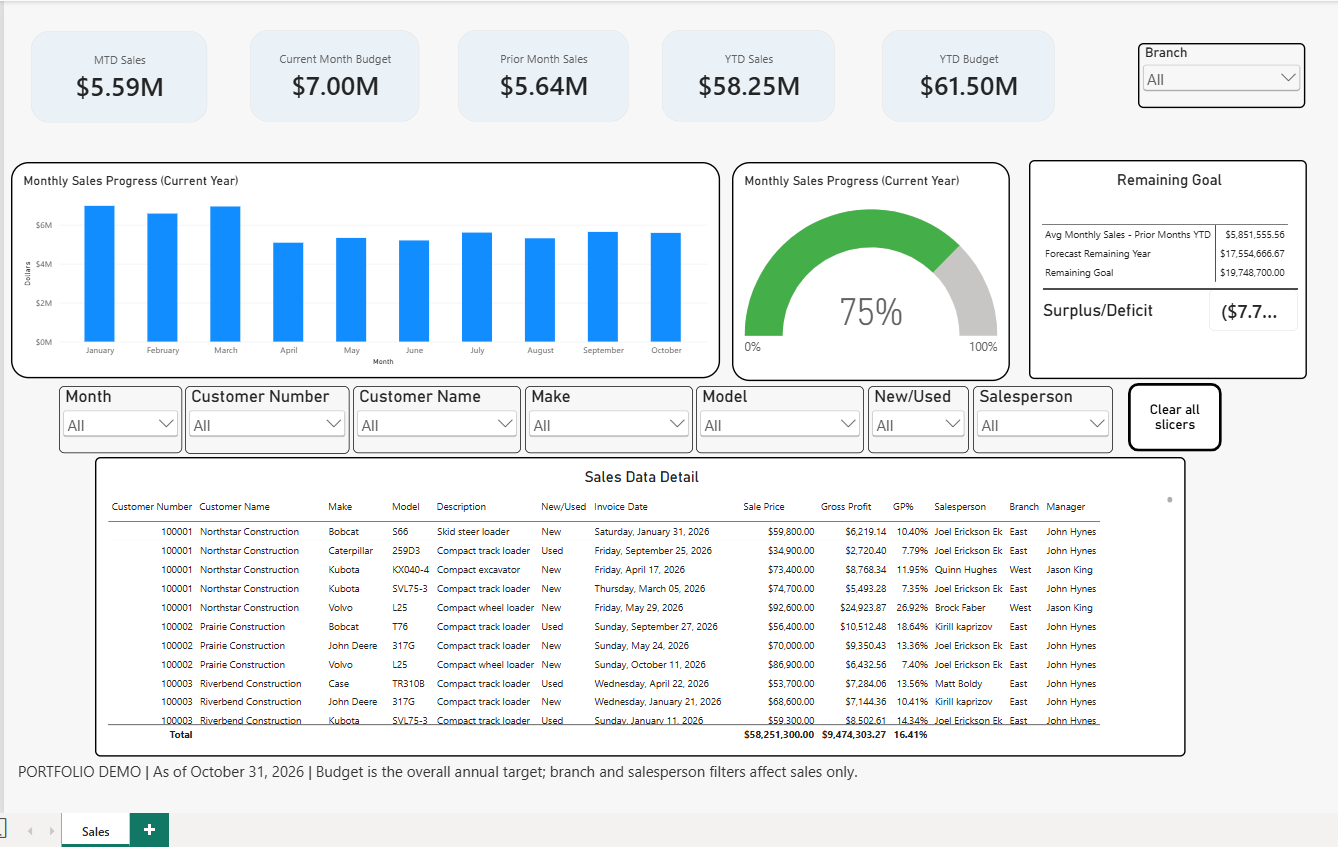
The management gap
Branch managers did not have a single view that brought together budget, year-to-date progress and the transaction detail behind those figures. They needed a way to measure sales activity and performance on demand, and use that information to lead their teams.
My approach
I created the dashboard for the branch manager, starting with a straightforward business goal: give managers a clear way to see what is happening. I brought budget, YTD performance and supporting detail into one Power BI reporting experience, so managers could assess progress and examine the figures behind it.
How it is used
The dashboard is now used during weekly progress updates with sales representatives at each branch. It provides a shared view of progress for those conversations, connecting team activity with branch performance against budget.
Leadership value
This project connects performance measurement with the routine of managing a sales team. Its value is the visibility it gives branch managers when they review progress with their representatives.
Explore the interactive demo
Filter the fictional data to explore the decisions this reporting supports. This is a web demo rebuilt from the portfolio data, separate from the Power BI report shown below.
The sales data and budget are fictional. Filters affect sales; the annual budget remains the overall target.
Power BI dashboard
Actual portfolio report using fictional sales and budget data. Reporting snapshot: October 31, 2026. Select the image to view it at full size.