The business priority
The rental manager and team needed to monitor the health of the rental fleet through three core measures: revenue, time utilization and financial utilization. They also needed to understand how much of the rental business was new business, alongside activity from existing customers.
My approach
I created a Power BI dashboard for the rental manager and team, bringing those fleet-health measures together with new and returning customer metrics. This portfolio report uses 2026 data, with YTD and MTD revenue, fleet utilization and customer activity. Filters let the team explore branches, equipment categories and date ranges.
Decisions supported
The dashboard gives the team a way to assess fleet performance using revenue and both utilization measures together. Customer metrics help them evaluate new-business activity while keeping existing relationships in view.
Strategic goal
The goal is to increase new rental business while growing the customer relationships already in place. The dashboard provides the visibility to support that strategy; the measures connect fleet performance with customer growth.
Explore the interactive demo
Filter the fictional data to explore the decisions this reporting supports. This is a web demo rebuilt from the portfolio data, separate from the Power BI report shown below.
Revenue is allocated evenly across inclusive rental dates. Time utilization is rented days divided by available days. Financial utilization is period revenue divided by average fleet NBV; the fleet contains only assets in the sample.
See the Power BI report
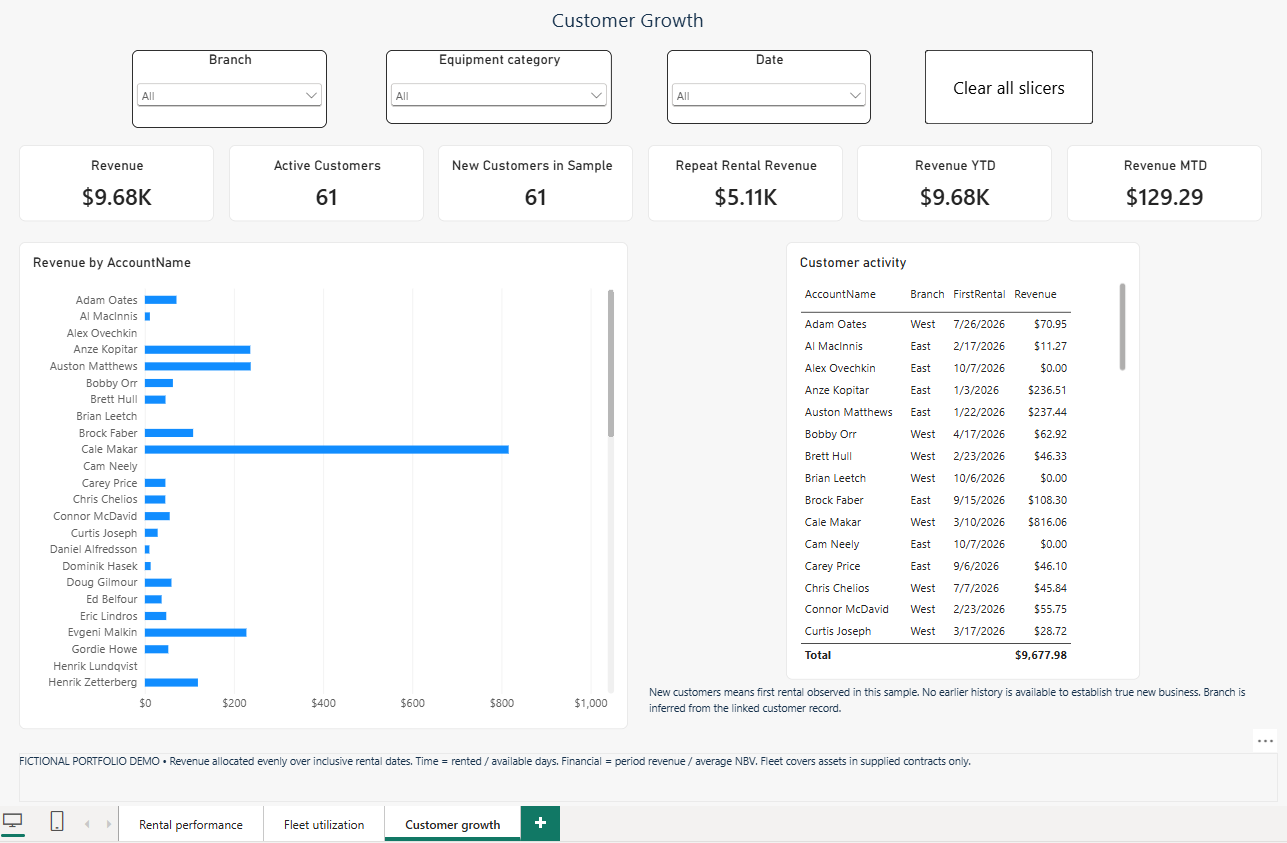
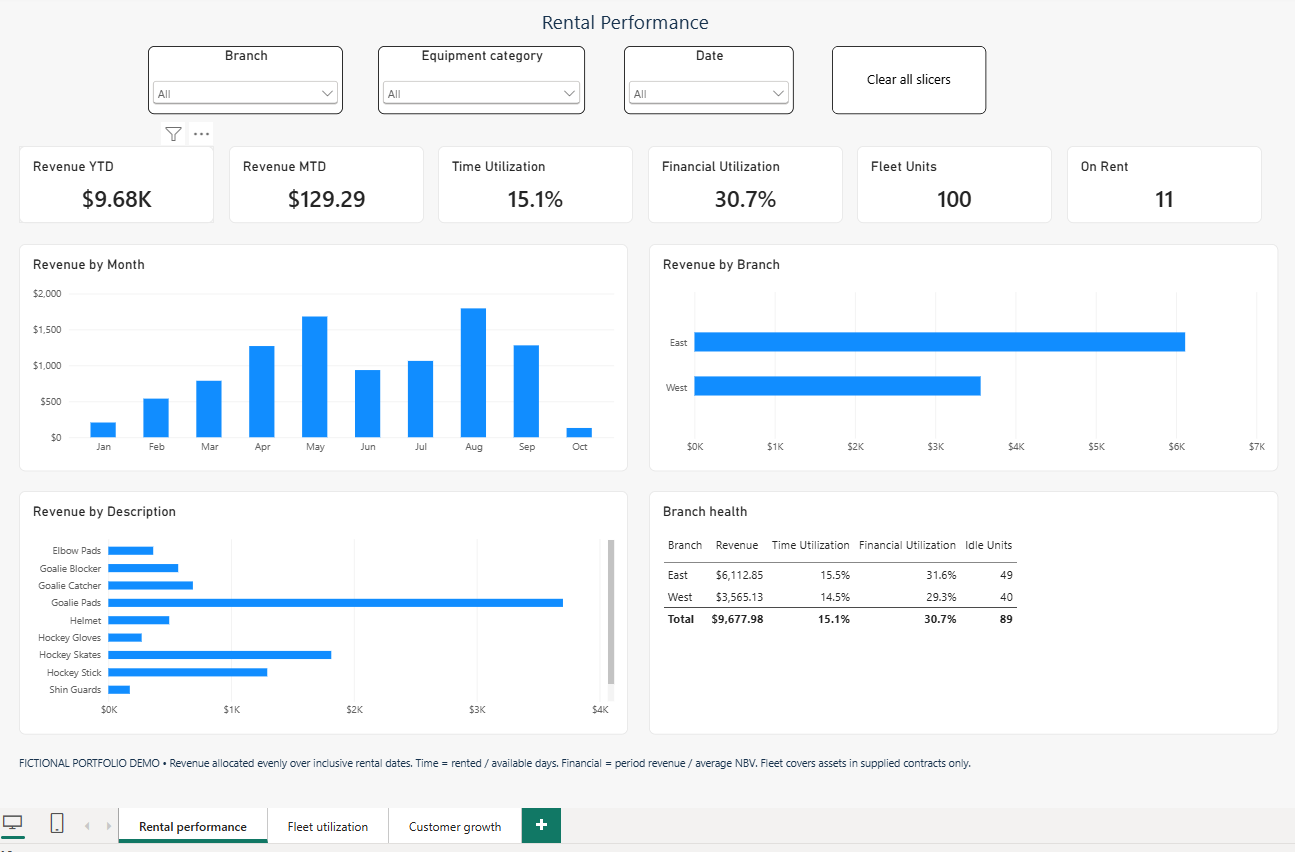
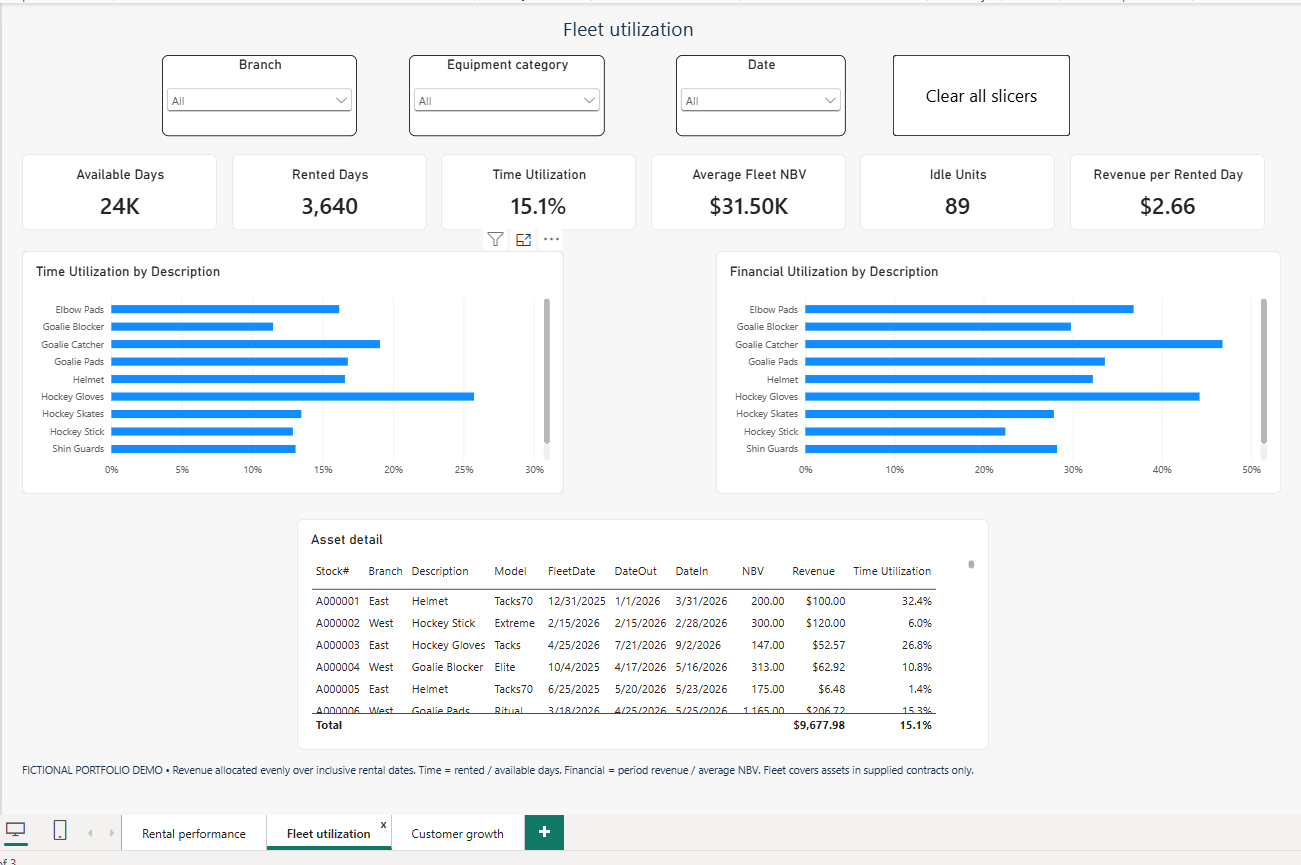
Three views connect fleet performance with customer activity. This portfolio version uses fictional hockey equipment and customer data, with hockey-player names. Select an image to view it at full size.
Rental performance
Revenue, time utilization and financial utilization give the team a shared view of fleet health, with branch and category detail to guide decisions.
Fleet utilization
Category comparisons and asset detail help the team identify idle capacity and evaluate how effectively the fleet generates revenue.
Customer growth
Customer activity and repeat rental revenue keep relationship growth visible alongside fleet performance. New customers here means first rental observed in this sample.