The business question
How could the business reduce aging used inventory, improve market visibility and make better trade and disposition decisions? Answering that required looking beyond a report to the process that moved each asset from acquisition to sale.
My approach
I audited the used-equipment workflow and brought together inventory, sales history, online listings and valuation data. I examined inventory mix, missing equipment information, listing coverage, time to sale and the effect of carrying costs on margin.
From findings to strategy
The analysis connected inconsistent records and fragmented handoffs with gaps in inventory visibility. It also examined how aging assets could expose the business to financing costs and changing market values. Those findings informed recommendations for data ownership, standardized intake, listing automation and regular inventory reviews.
Implemented workflow changes
The analysis led to three recurring practices that connected the findings with day-to-day inventory management:
- Monthly stakeholder review: Review current inventory aging together and identify equipment that needs attention.
- Monthly inventory audit: Identify used machines entering the fleet, review acquisition cost and projected sale price, and trigger availability for sale and website listing.
- Monthly pricing adjustments: Reassess pricing using market conditions, time in inventory and the need to move each asset.
Connecting strategy with execution
I translated the analysis into a regular cadence for reviewing inventory, bringing newly acquired equipment to market and adjusting prices. These workflow changes put the strategy into practice and gave stakeholders recurring opportunities to act on the data.
The analysis in three views
These visuals rebuild the analytical concepts with entirely fictional figures, dates and scenarios. They illustrate the analytical method; the workflow changes described above were implemented, while the figures shown here are fictional.
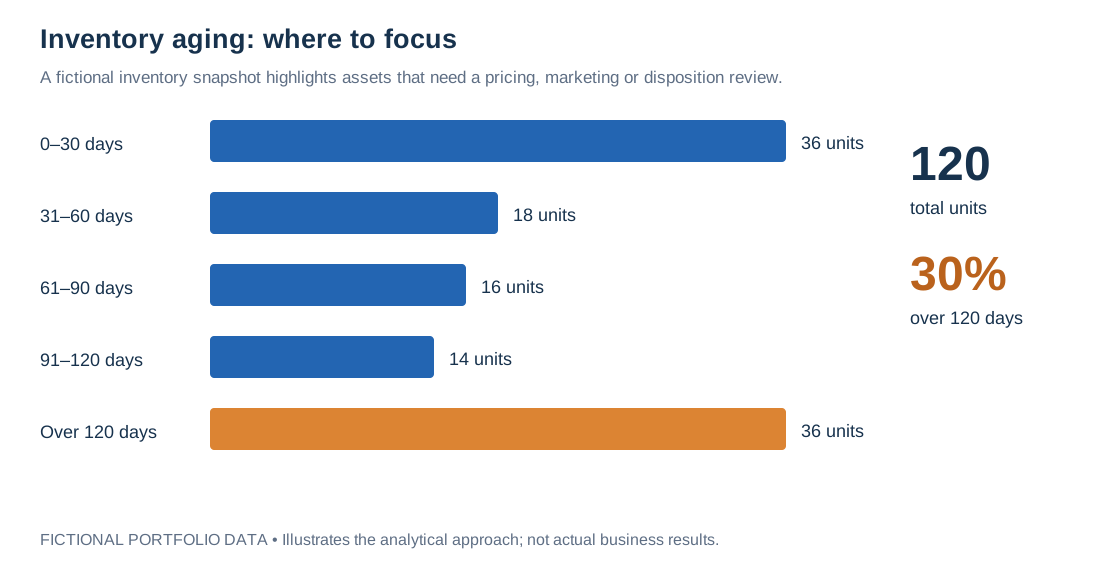
Inventory aging
Use age bands to focus reviews on inventory that has remained on hand longest.
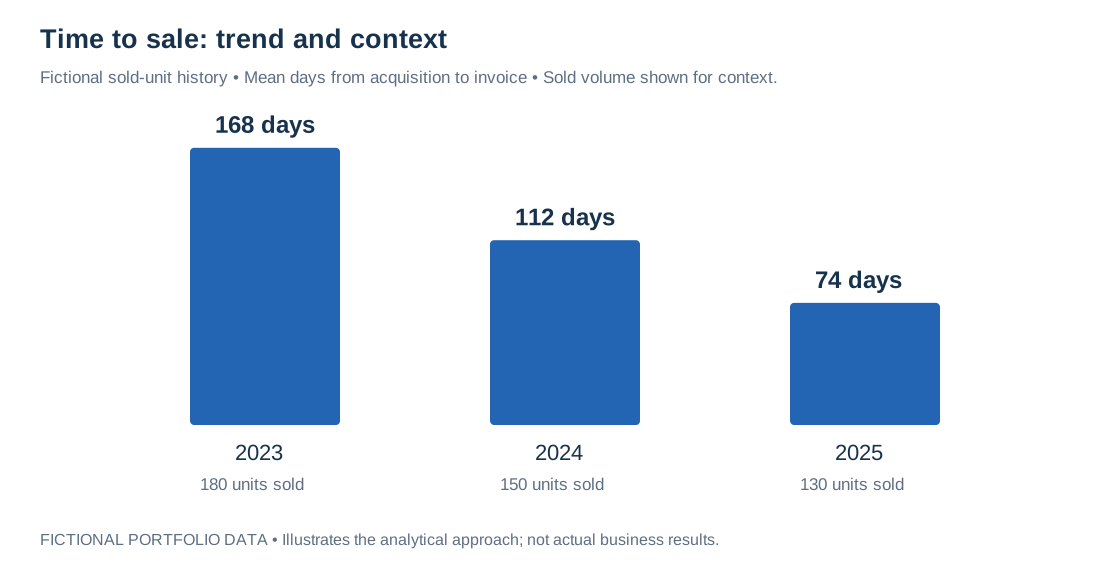
Time to sale
Review sales-cycle trends alongside volume and equipment mix. A lower average alone does not establish what caused the change.
Carrying costs and margin
Model the financing cost of actual holding days to see how time can erode gross profit.
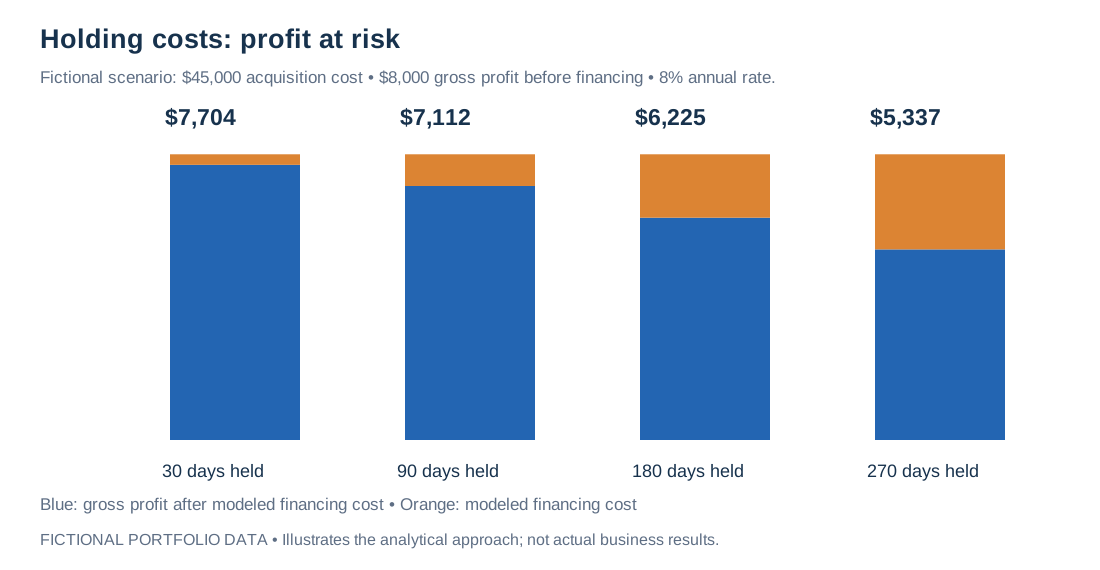
Method notes: the time-to-sale view includes sold units only and should be reviewed alongside unsold inventory. Sales-to-acquisition ratios describe period activity; true sell-through requires tracking the same acquisition cohort. The financing illustration uses acquisition cost × assumed annual rate × days held ÷ 365. Gross profit after financing excludes commissions, repairs and other overhead, so it is not net profit.